Keep your own routing.
Choose the upstream base URL, credentials, and path on each request. Constrain accepted prefixes. There is no separate provider registry or key vault to maintain.
Read the protocol guideself-hosted · cross-protocol · MIT
A self-hosted, cross-protocol inference proxy with a live dashboard, SQLite history, and controls to pause, limit, or debug traffic. OpenAI Chat Completions, OpenAI Responses, and Anthropic Messages clients can target any configured upstream. Request metadata, timing, tokens, cost, and outcomes; body capture is opt-in.
MIT licensedone Go binarySQLite or in-memory
 millivolt
translate · route
any configured upstream
the short version
One request path, one operator surface. The proxy stays out of your provider contracts and the dashboard stays close to the traffic.
Choose the upstream base URL, credentials, and path on each request. Constrain accepted prefixes. There is no separate provider registry or key vault to maintain.
Read the protocol guideLive rows, durable history, and scoped timelines for clients, providers, models, conversations, tools, status, and keys. Open a row for timing, tokens, cost, and retries.
Tour the dashboardPause new work by scope, cap traffic by provider, model, client, key or conversation on a recurring schedule, capture bounded debug bodies, export exactly the records you filtered, and protect against error storms.
Operator workflowsthe instrument
Global totals stay global; scoped explorer cards, timelines, and the request log share one selected scope. The dashboard is dense because the traffic is.
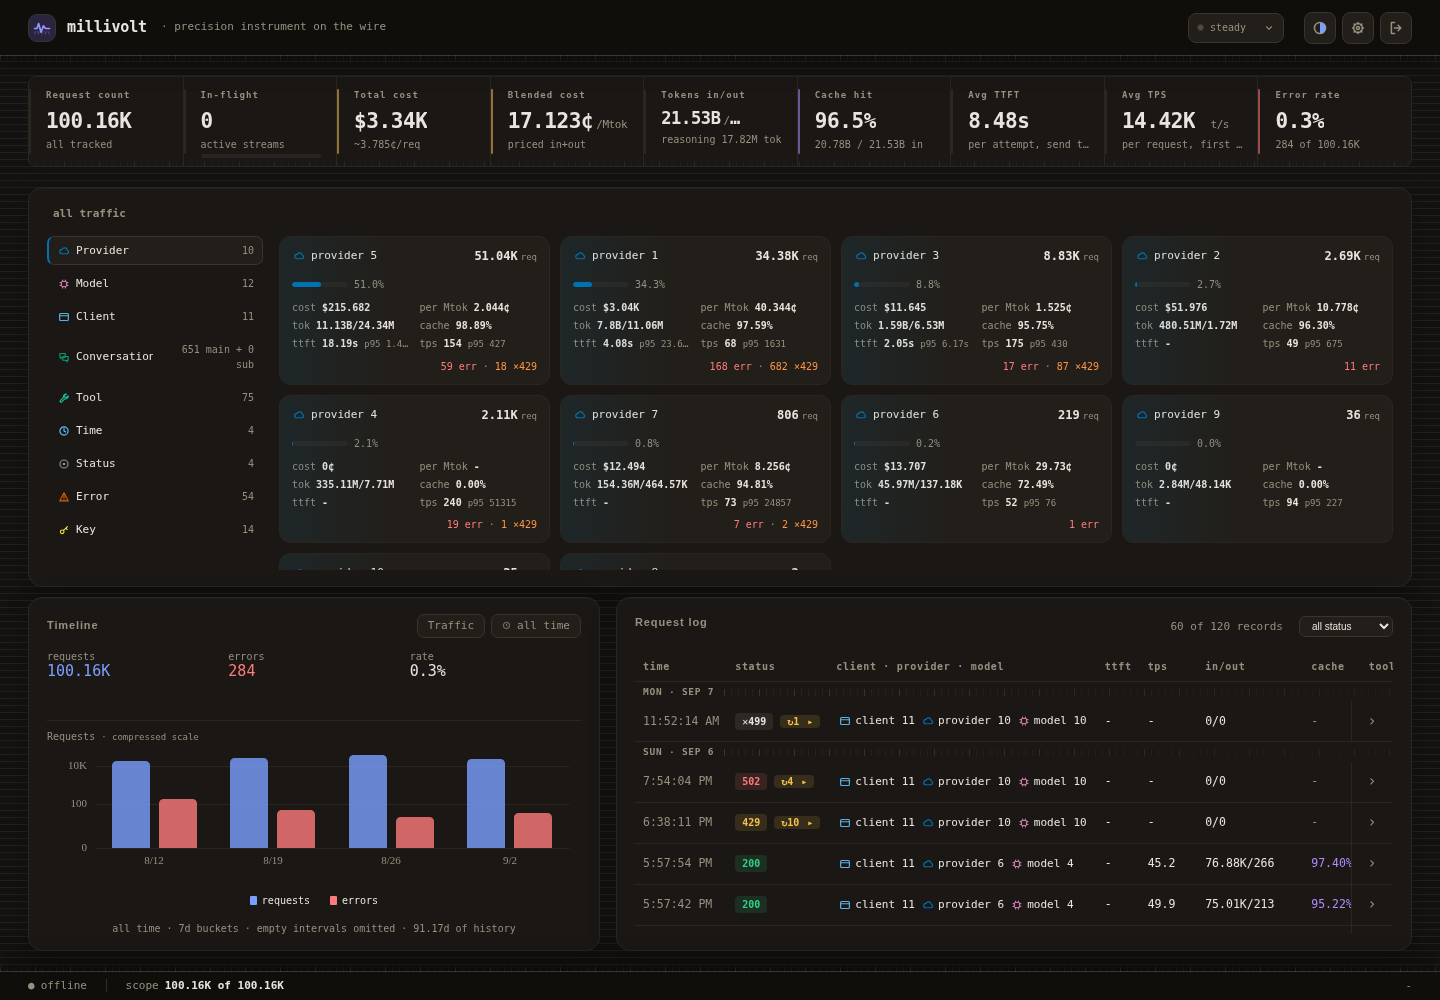
Requests, tokens, spend, cache hit rate, errors, and speed, with their ranges.
Drill into providers, models, clients, conversations, tools, time, status, and keys.
Six chart presets share one time window and one selected scope.
Live rows plus retained history, with a drawer for timing and outcome metadata.
signal
See requests, tokens, errors, and cost as separate questions. A 429 is a throttle, not an error; the charts keep that distinction.
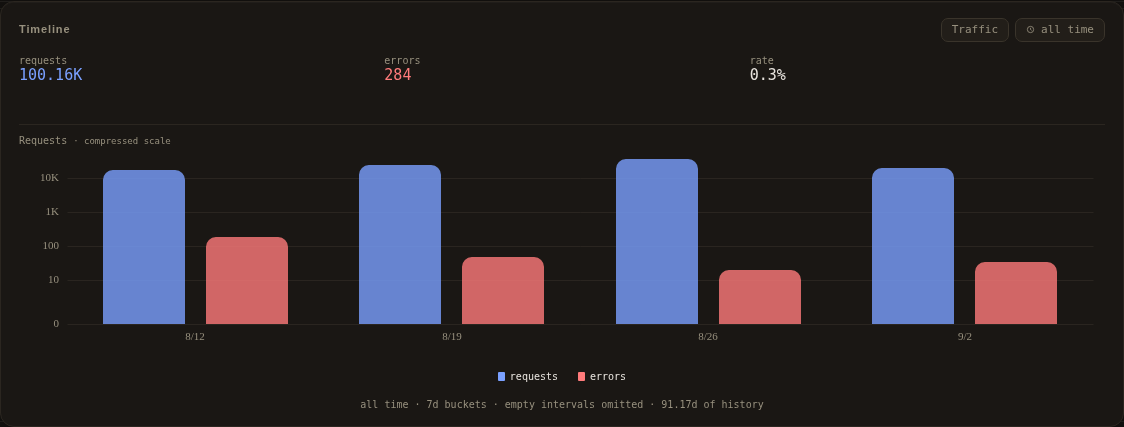
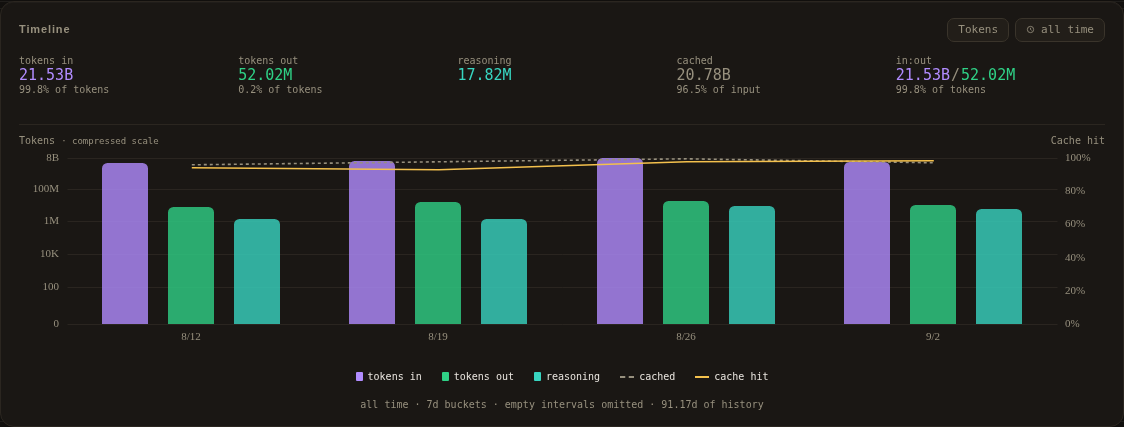
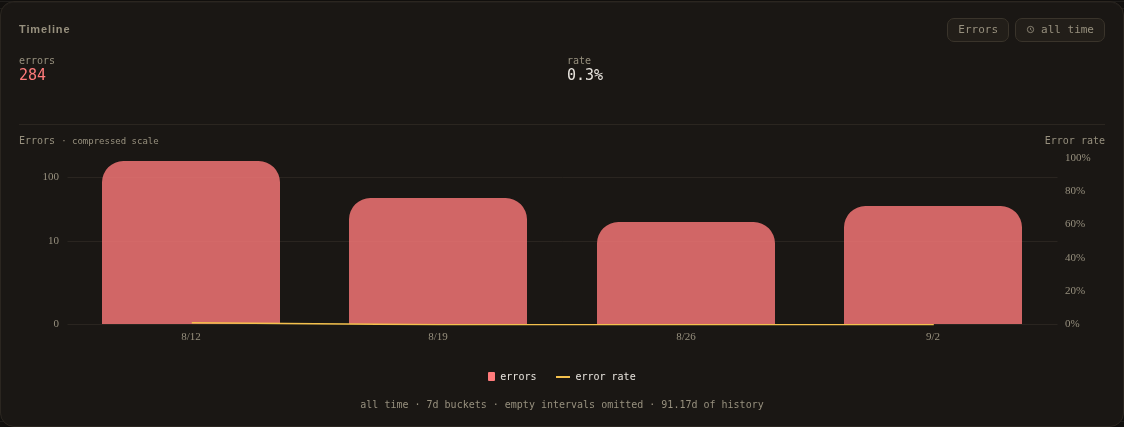
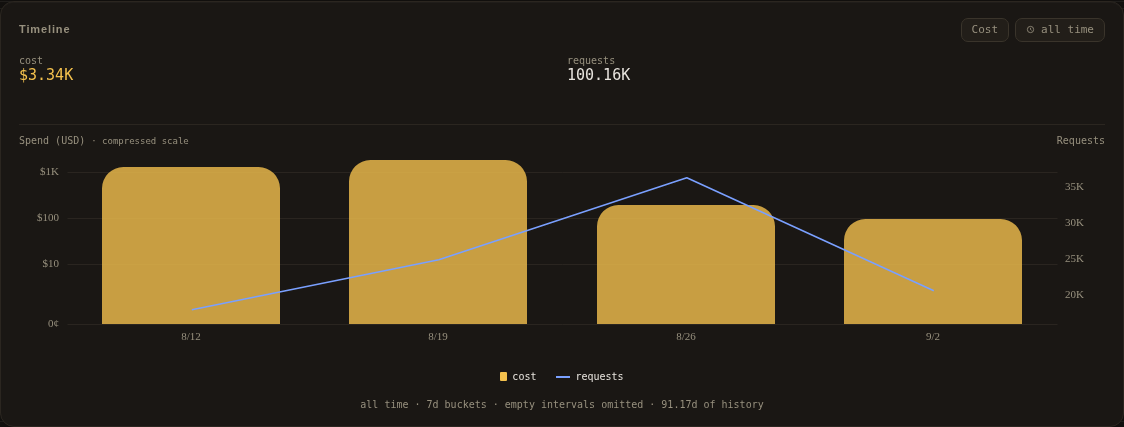
Swipe to compare charts.
operator surface
One readout says whether anything is in force. One console holds every policy, the export and the restart, and each write leaves a sentence you can undo.
Operator actions, not per-user permissions. Inference stays transparent.
Read operator workflowsin-flight streams finish
captured bodies stay sensitive
7 recordsJSON, gzipdownload
preview and download share one predicate
rebuild and restart4 steps
queue, retry and retention live in Settings
steady when nothing is in force, otherwise one segment per hold, capture, enforcing limit, off schedule policy, restart or gated backlog, and the overview is that same reading.run it
Linux with Docker Engine and the Compose plugin. No Go, Node, or source checkout is needed for the container path.
curl -fsSL \
  https://raw.githubusercontent.com/LLM-4-People/millivolt/main/compose.yaml \
  -o compose.yaml
export MILLIVOLT_OPERATOR_TOKEN='replace-with-a-long-random-value'
docker compose up -d
Open http://127.0.0.1:8080/ and sign in with that token.
http://127.0.0.1:8080/v1 as the API base URL. Your upstream key is forwarded; it does not authenticate the dashboard.Keep the listener on loopback, or put an authenticated proxy in front. There are no user accounts. Read security before network exposure.
Point an OpenAI Chat Completions, OpenAI Responses, or Anthropic Messages client at http://127.0.0.1:8080/v1. Send your upstream base URL in X-Proxy-Base-URL, your upstream key in Authorization, and an optional label in X-Proxy-Client. The proxy does not register providers or keys.
Protocol and client integration · Adapters and compatibility
under the hood
The proxy, dashboard, retained history, and operator API ship together. There is no separate database server, frontend runtime, or monitoring pipeline.
fit and limits
millivolt is built for a single operator or small team that controls the host. The limits are part of the contract, not a footnote.
A single credential protects the dashboard and operator plane; inference is transparent and depends on the network boundary. There are no per-user accounts or tenant boundaries.
Sustained overload can drop records even when inference succeeds. The dashboard warns about process-local storage drops.
Cost is provider-reported. This is not an independent invoice, a complete audit log, or a compliance system.
measured
Current local measurements of the native process, including a deliberate overload fixture. These are scoped examples, not deployment guarantees.
Measured 2026-10-20; sustained capacity at 54d1276, artifact and five-second tables at facb699, on a shared WSL2 workstation. A separate overload fixture records the drop case. See method, tables and scope.
start here
Three commands, one binary, your keys. Keep the traffic where you can see it.