
Capture gallery
37 plates across 7 stations, captured 16 November 2026 UTC from 100,158 recorded requests with identifiers replaced and content removed.
Every plate is one state photographed on both primary surfaces and split along the diagonal from the bottom-left corner to the top-right. The upper-left half is Instrument Black, the lower-right half is Instrument Clear. Nothing else changes between the halves: the same data, the same scroll, the same open surface.
Values are a static sample from recorded history, not a benchmark. The offline indicator describes the capture session.
The whole bench
The default view at 1920 px and at phone width; every plate carries the Black and Clear surfaces across one diagonal.
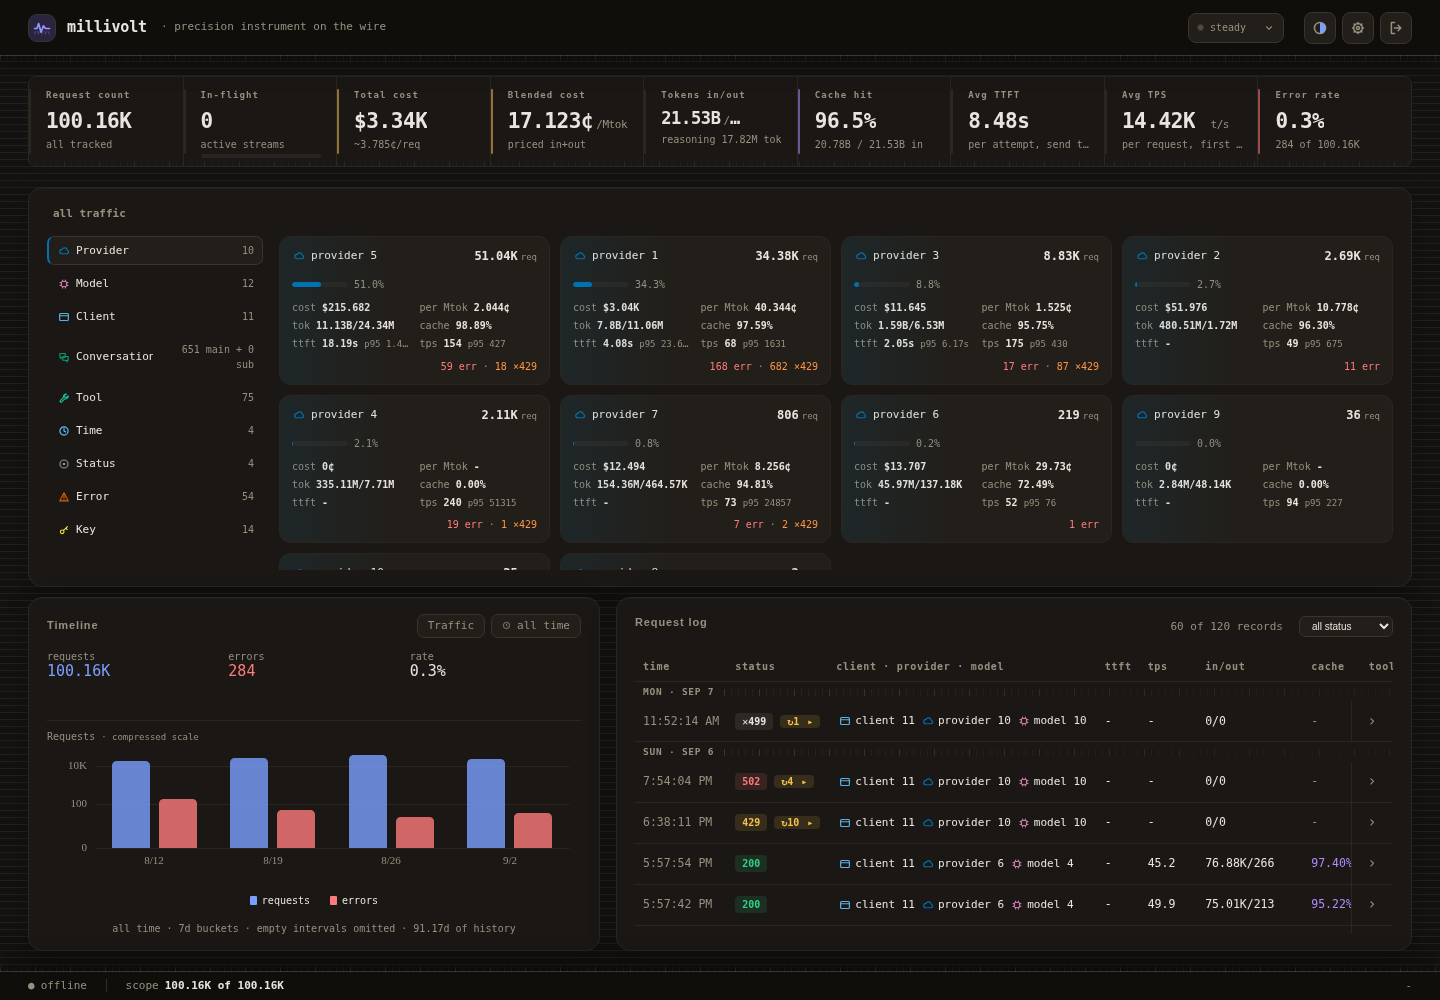
Global totals stay fixed while the explorer scopes the timeline and log; upper-left Black, lower-right Clear. The plate is split diagonally: the upper-left half is Instrument Black, the lower-right half is Instrument Clear.
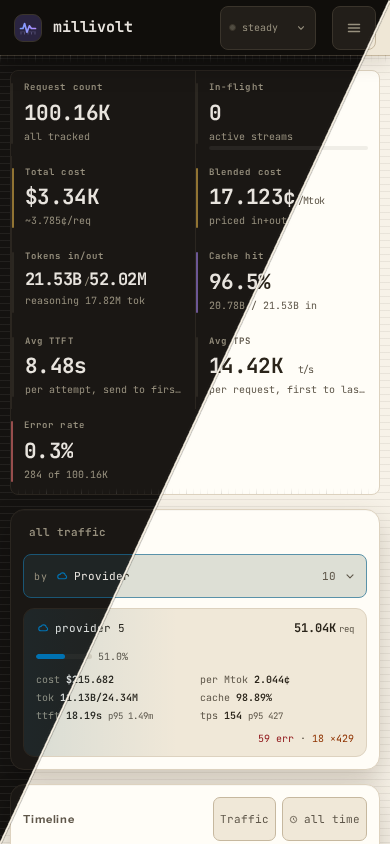
Below 1200 pixels the locked bench becomes a scrolling page and the nine-item rail becomes one picker. The plate is split diagonally: the upper-left half is Instrument Black, the lower-right half is Instrument Clear.
Six readings of one ruler
The plotted presets, the summary tiles, and the window picker that bounds them.

The overview preset answers what the window contains before any series is drawn. The plate is split diagonally: the upper-left half is Instrument Black, the lower-right half is Instrument Clear.
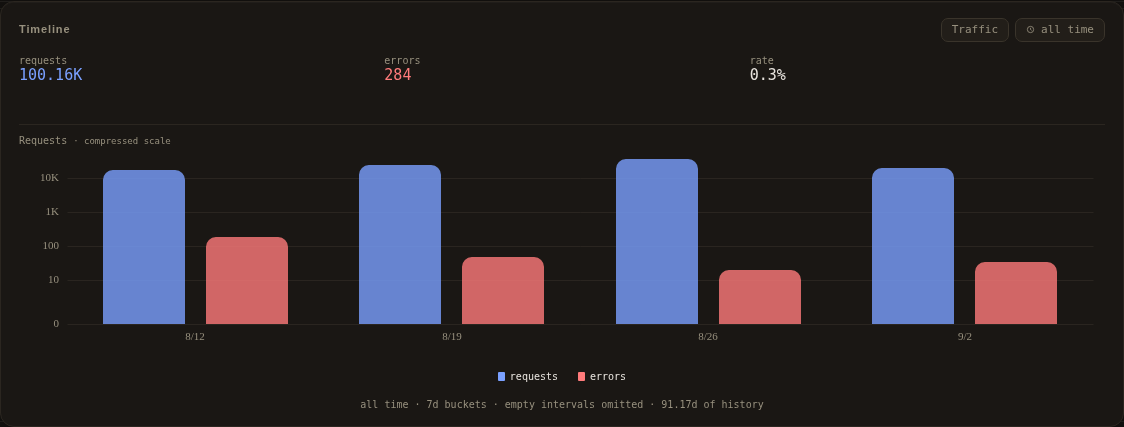
Requests and errors share one time axis; the totals strip carries the window rate. The plate is split diagonally: the upper-left half is Instrument Black, the lower-right half is Instrument Clear.
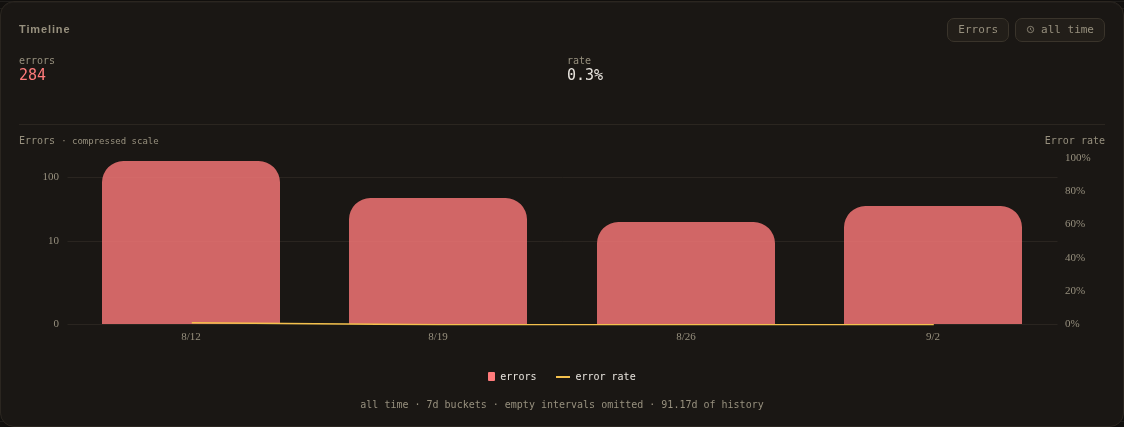
A 429 is a rate limit, not an error; the two series stay separate. The plate is split diagonally: the upper-left half is Instrument Black, the lower-right half is Instrument Clear.
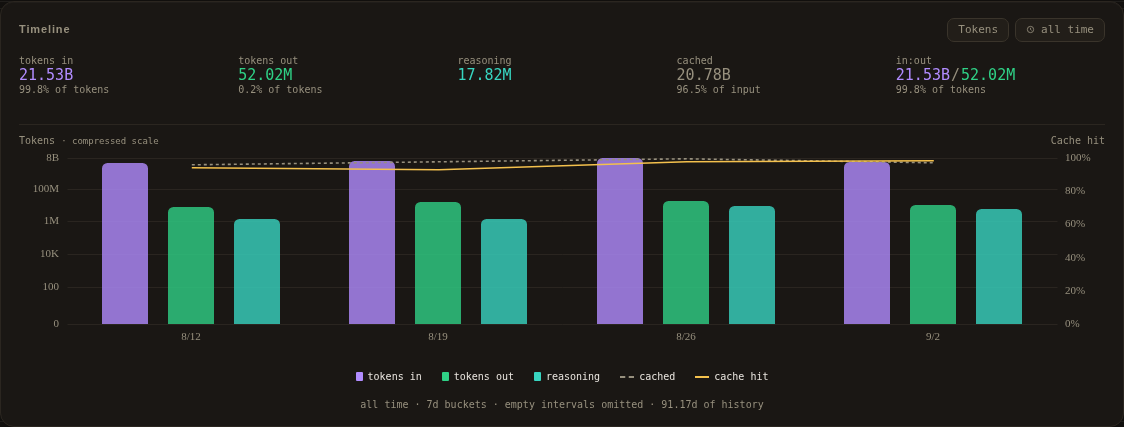
Cached reads are drawn beside billed input, so a high cache share is visible rather than inferred. The plate is split diagonally: the upper-left half is Instrument Black, the lower-right half is Instrument Clear.
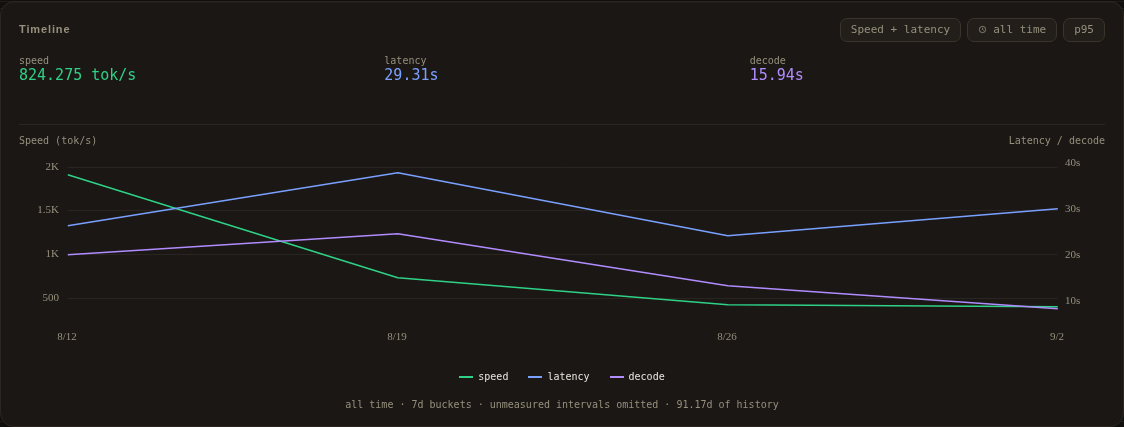
The percentile control applies to every measured rate in the preset. The plate is split diagonally: the upper-left half is Instrument Black, the lower-right half is Instrument Clear.
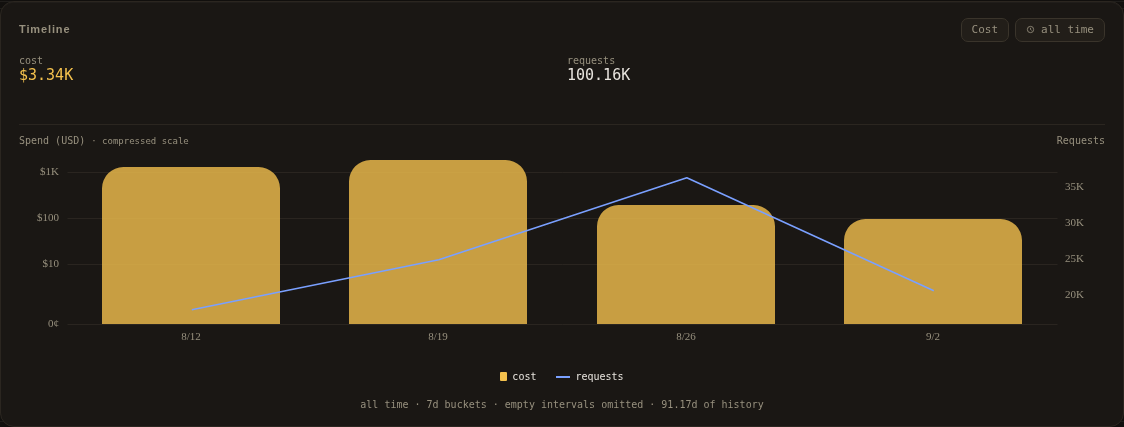
Spend is whatever the upstream reported, plotted beside the request volume that produced it. The plate is split diagonally: the upper-left half is Instrument Black, the lower-right half is Instrument Clear.
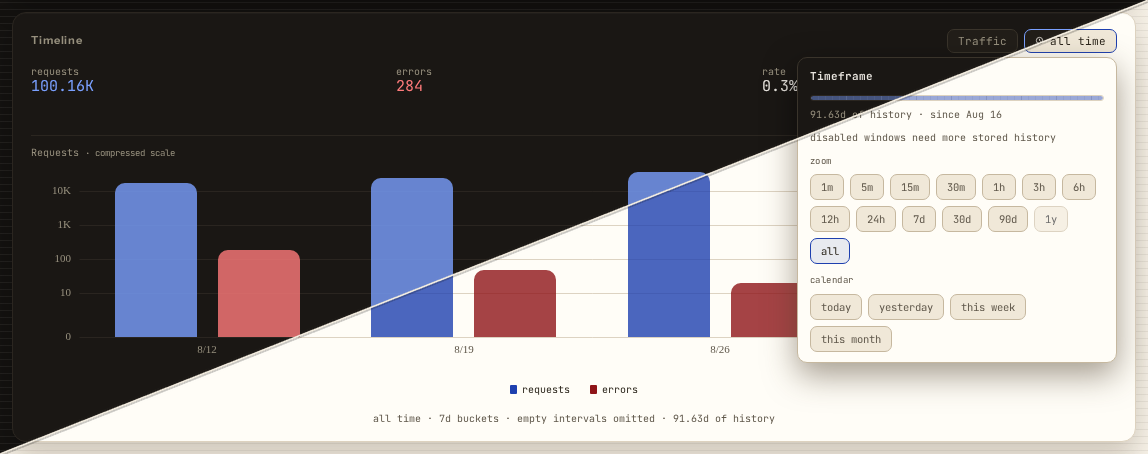
Windows wider than the stored history are disabled, so the picker cannot promise history that is not there. The plate is split diagonally: the upper-left half is Instrument Black, the lower-right half is Instrument Clear.
Nine ways into the traffic
The dimension rail, its cards, and one scoped reading.
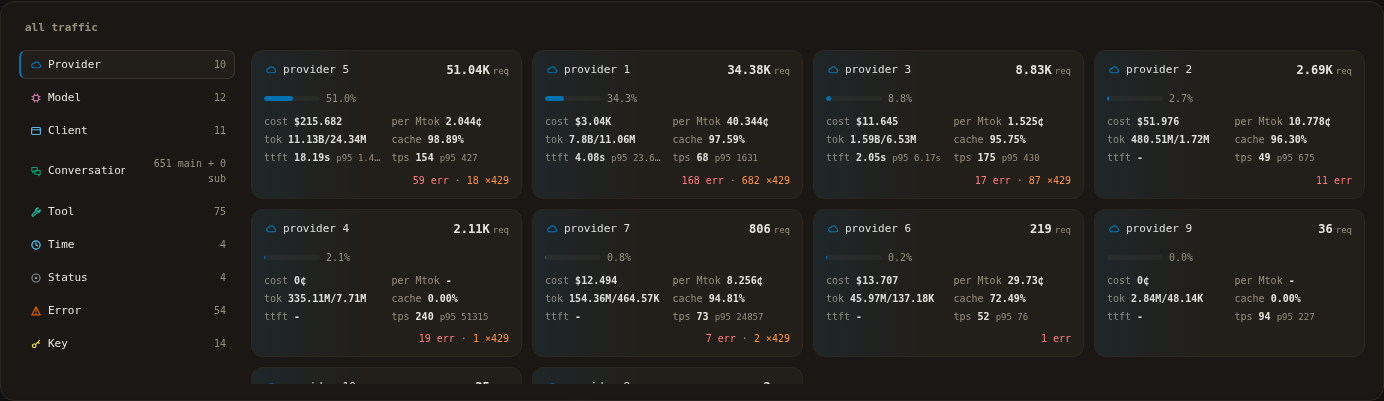
The rail counts distinct values; each card shows its share and the signals that matter for that dimension. The plate is split diagonally: the upper-left half is Instrument Black, the lower-right half is Instrument Clear.
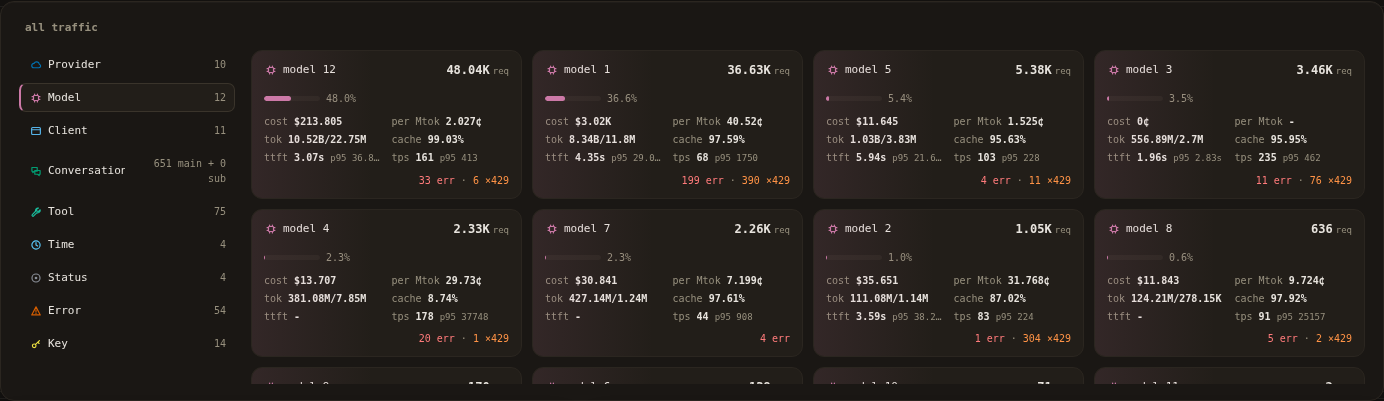
The model dimension applies the configured grouping rules before it counts. The plate is split diagonally: the upper-left half is Instrument Black, the lower-right half is Instrument Clear.
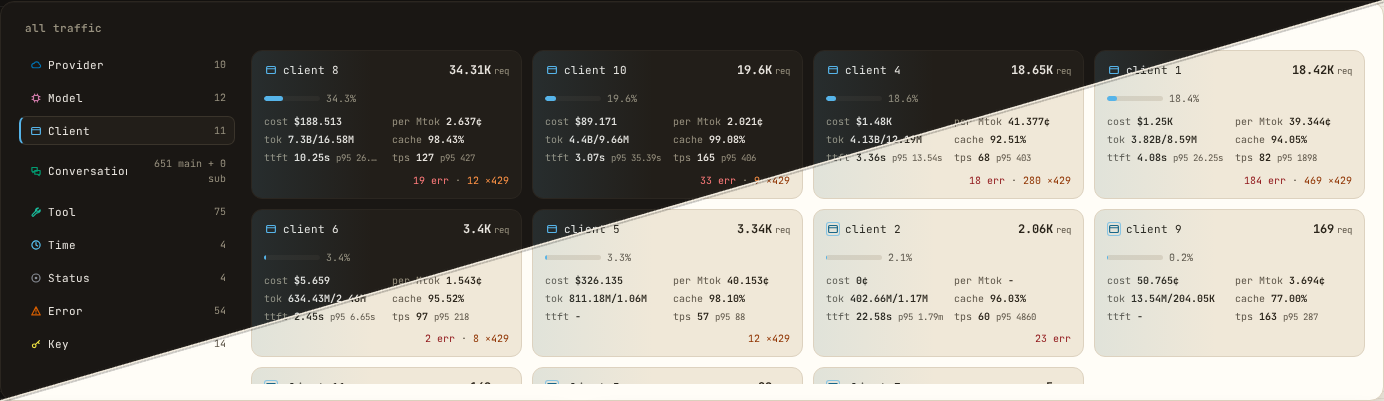
The client dimension answers which caller produced a share of the window. The plate is split diagonally: the upper-left half is Instrument Black, the lower-right half is Instrument Clear.
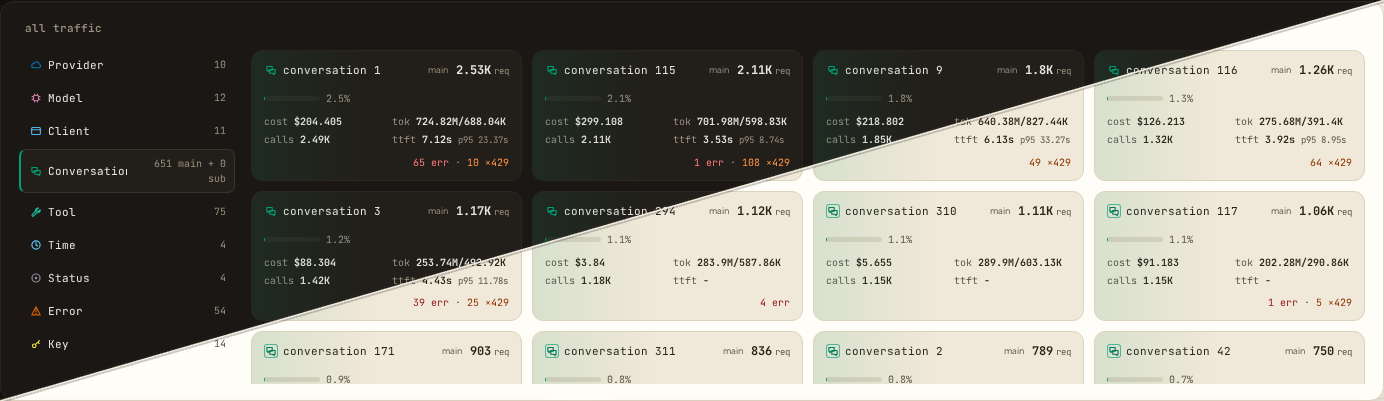
Conversation filters select exact leaves; the rail reports main and sub conversations separately. The plate is split diagonally: the upper-left half is Instrument Black, the lower-right half is Instrument Clear.
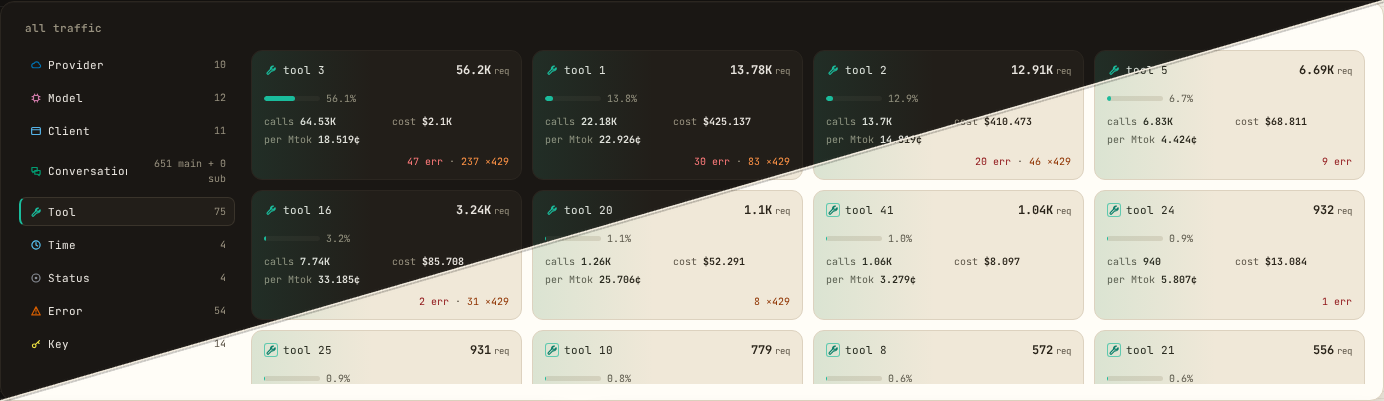
The tool dimension counts calls the relay observed, not calls a client claimed. The plate is split diagonally: the upper-left half is Instrument Black, the lower-right half is Instrument Clear.
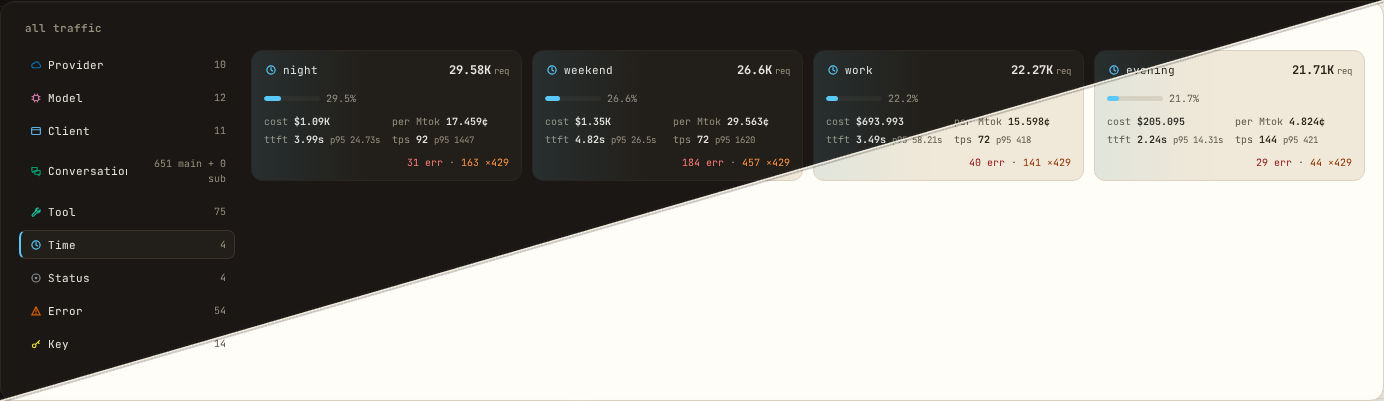
Time is a grouping like any other, so a bucket can be filtered and compared with the rest of the window. The plate is split diagonally: the upper-left half is Instrument Black, the lower-right half is Instrument Clear.
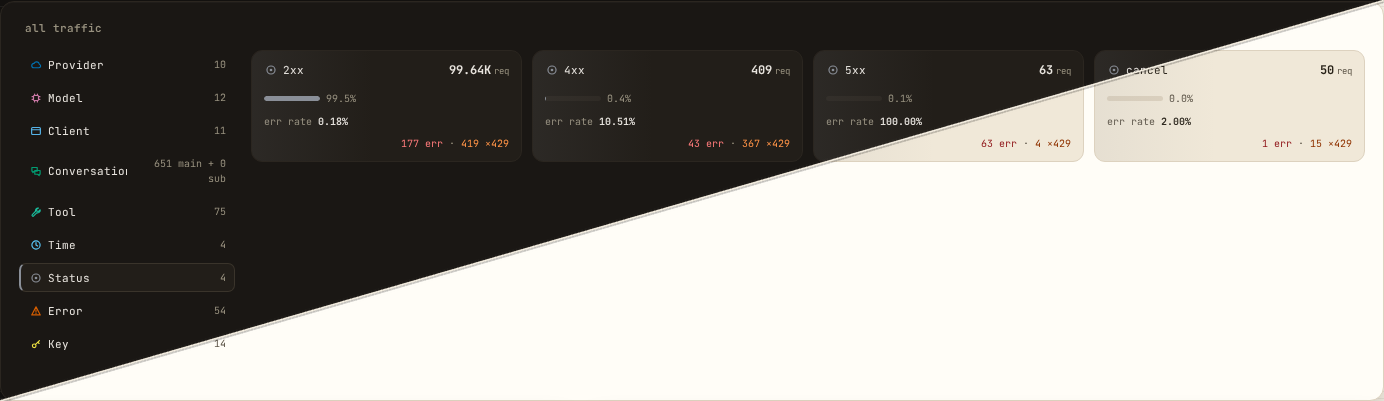
The status dimension separates what the client received from what the upstream first returned. The plate is split diagonally: the upper-left half is Instrument Black, the lower-right half is Instrument Clear.
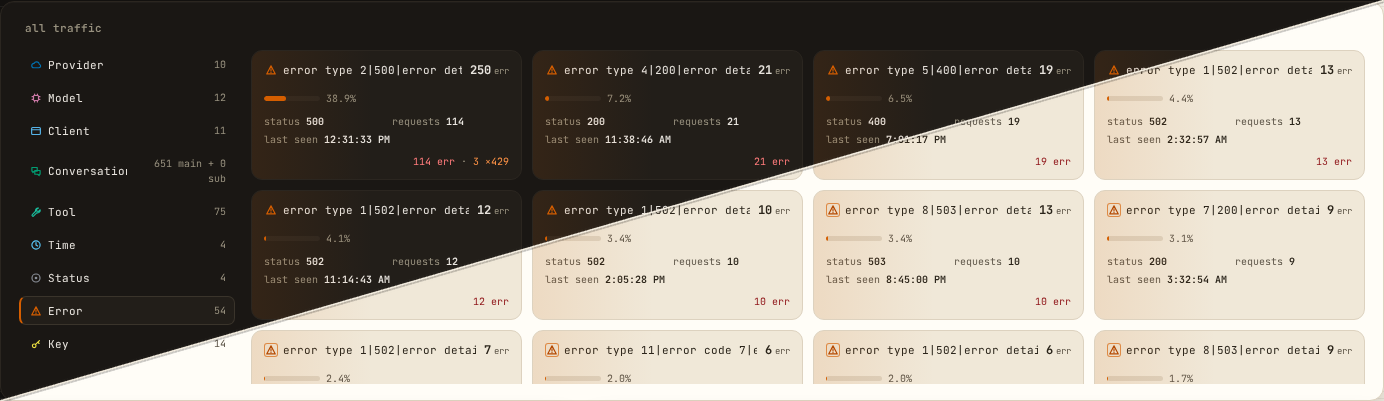
The error dimension groups by the proxy's canonical class, not by provider wording. The plate is split diagonally: the upper-left half is Instrument Black, the lower-right half is Instrument Clear.
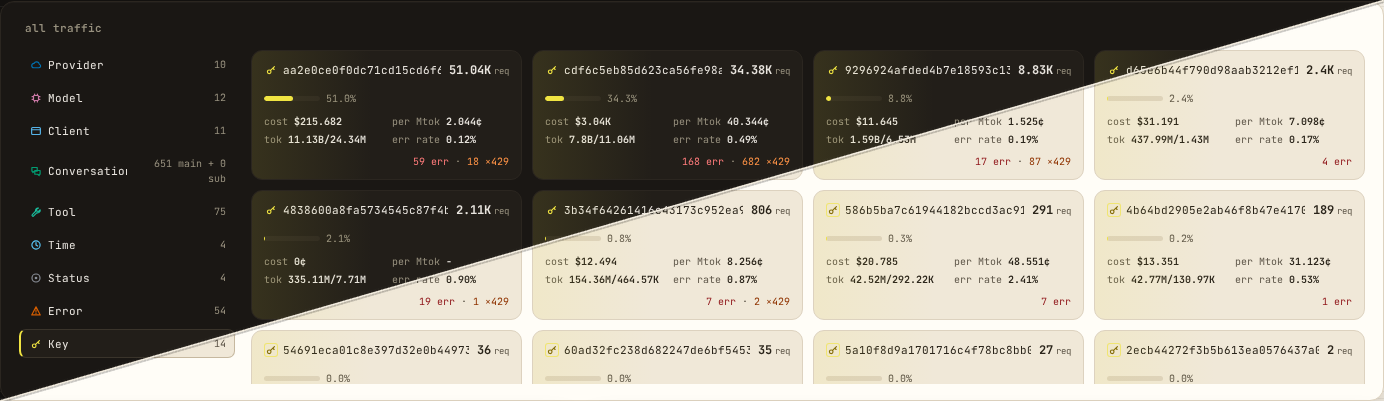
Keys are hashed in the copy, so a group is stable without exposing a credential. The plate is split diagonally: the upper-left half is Instrument Black, the lower-right half is Instrument Clear.
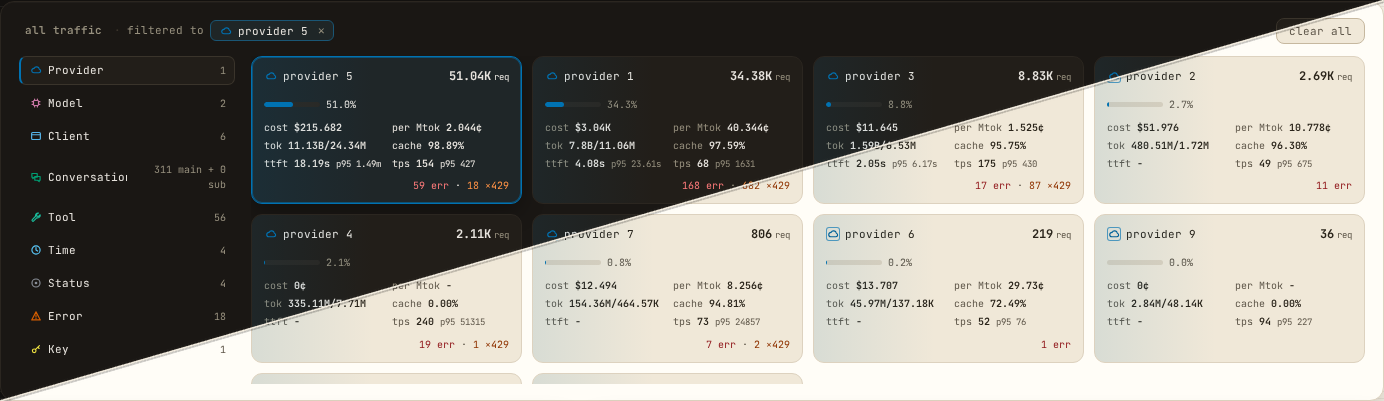
A card toggles an exact filter; the chip removes it, and the timeline and log follow the same scope. The plate is split diagonally: the upper-left half is Instrument Black, the lower-right half is Instrument Clear.
Every crossing
The request log, an absorbed retry, and the drawer that explains a single crossing.
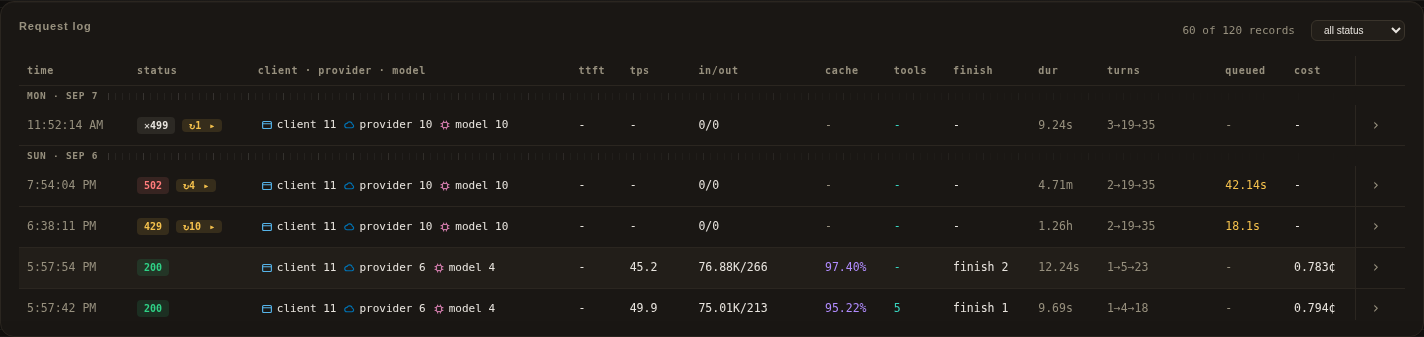
Each row is one crossing; the columns are the facts a later review needs first. Scroll the plate horizontally to see every column. The plate is split diagonally: the upper-left half is Instrument Black, the lower-right half is Instrument Clear.
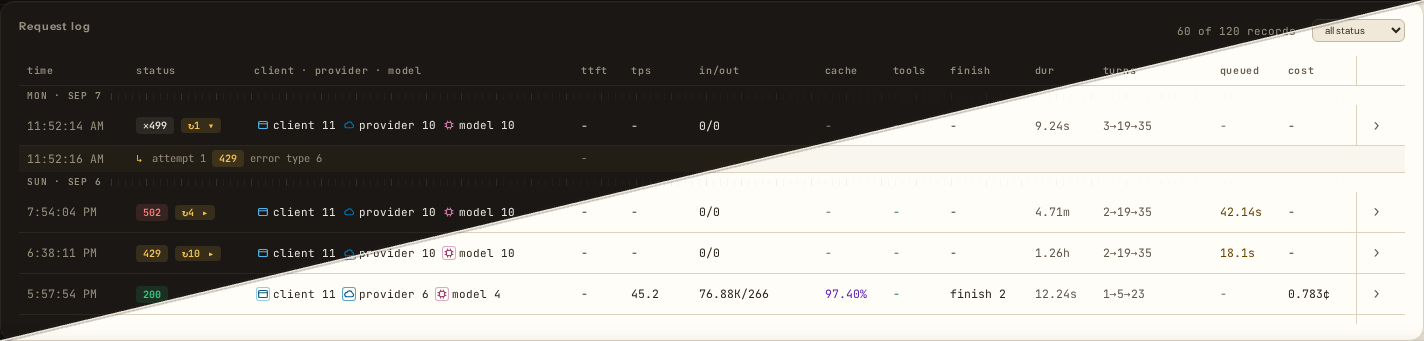
A retry the client never saw is still a recorded upstream attempt. Scroll the plate horizontally to see every column. The plate is split diagonally: the upper-left half is Instrument Black, the lower-right half is Instrument Clear.
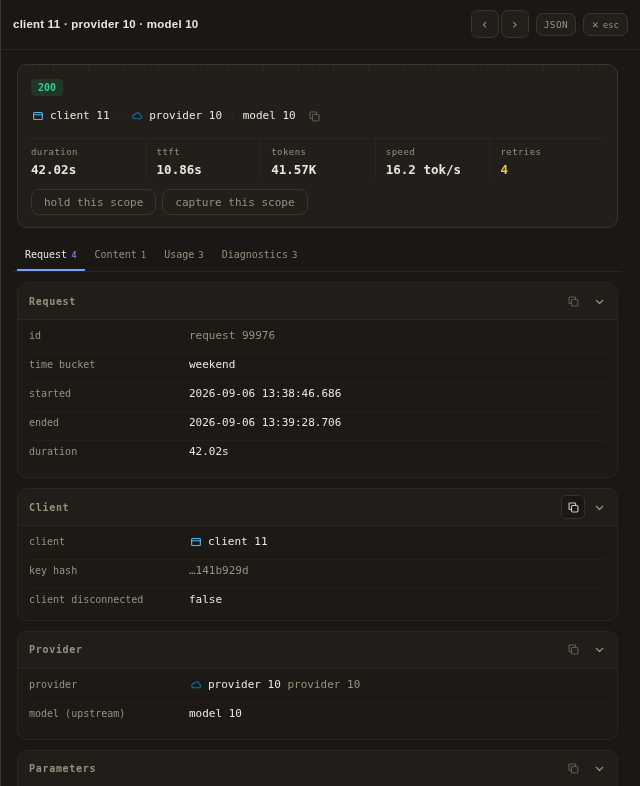
The drawer opens on the record, not on a reconstruction of it. The plate is split diagonally: the upper-left half is Instrument Black, the lower-right half is Instrument Clear.
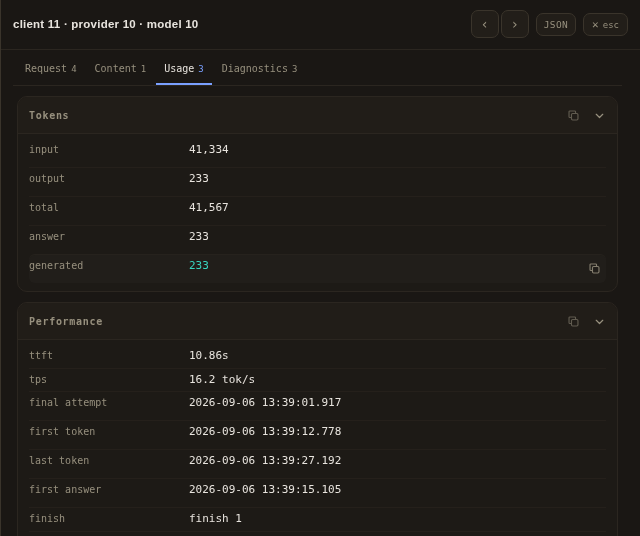
Usage is grouped by the question it answers, so timing and tokens do not compete in one list. The plate is split diagonally: the upper-left half is Instrument Black, the lower-right half is Instrument Clear.
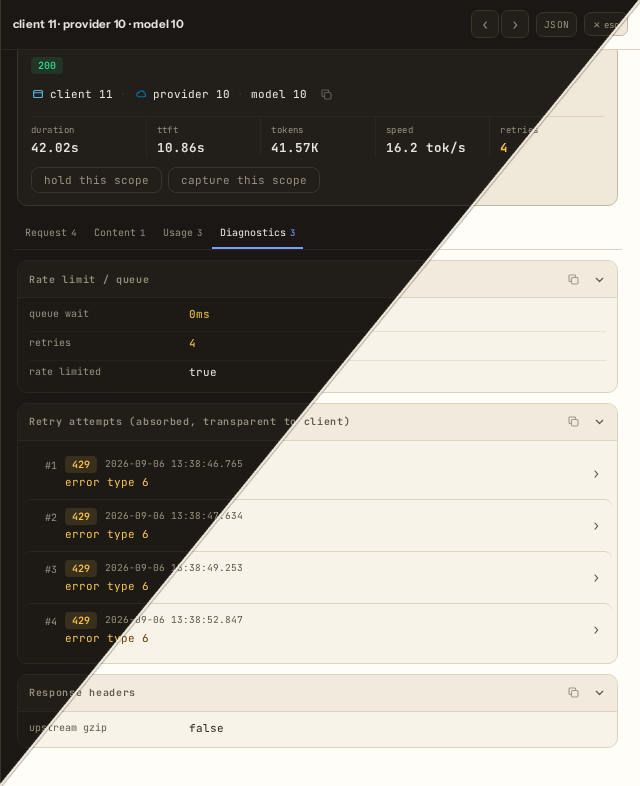
The diagnostics group is where a transparent retry stops being invisible. The plate is split diagonally: the upper-left half is Instrument Black, the lower-right half is Instrument Clear.
The operator plane
The five policy sections and the composer behind them.
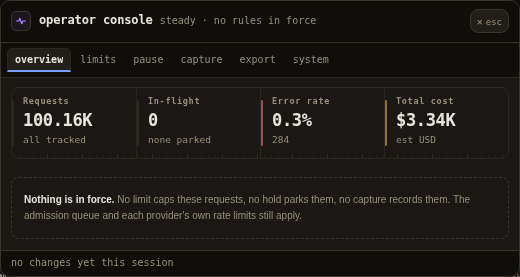
The overview is the register of what is in force, not a second settings form. The plate is split diagonally: the upper-left half is Instrument Black, the lower-right half is Instrument Clear.
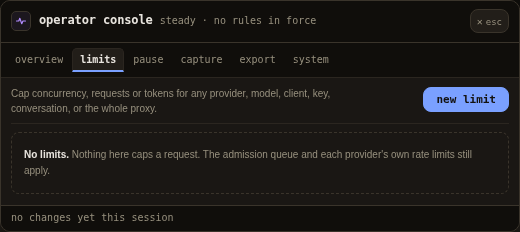
An empty policy surface states the state instead of hiding it. The plate is split diagonally: the upper-left half is Instrument Black, the lower-right half is Instrument Clear.
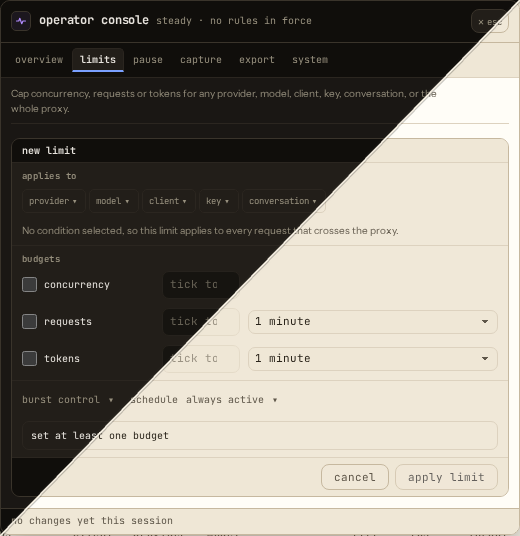
A draft is local until it is committed; the composer previews the effect before a write. The plate is split diagonally: the upper-left half is Instrument Black, the lower-right half is Instrument Clear.
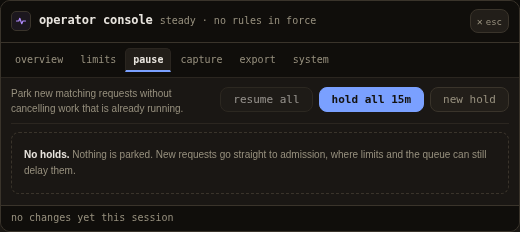
A hold parks new work for a scope without changing a route. The plate is split diagonally: the upper-left half is Instrument Black, the lower-right half is Instrument Clear.
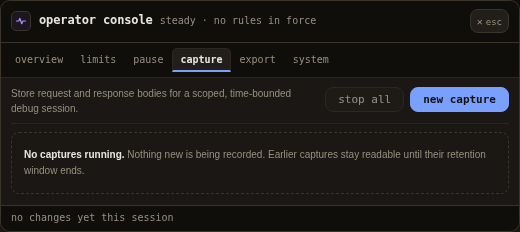
A capture session retains bodies for a bounded scope and time; the panel states both. The plate is split diagonally: the upper-left half is Instrument Black, the lower-right half is Instrument Clear.
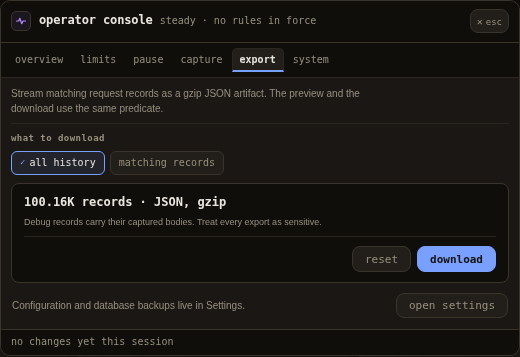
The receipt counts what the chosen mode will write before the file is produced. The plate is split diagonally: the upper-left half is Instrument Black, the lower-right half is Instrument Clear.
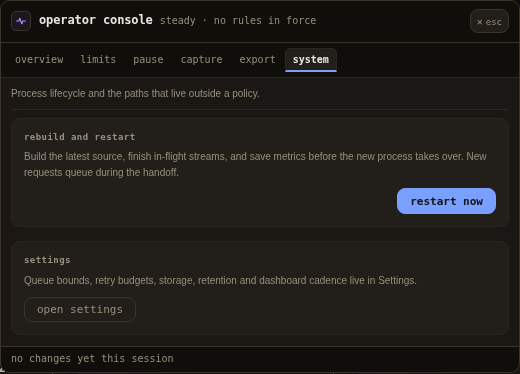
A restart is a state machine with named steps, not a button with a spinner. The plate is split diagonally: the upper-left half is Instrument Black, the lower-right half is Instrument Clear.
The patch panel
Five categories of the public example configuration.
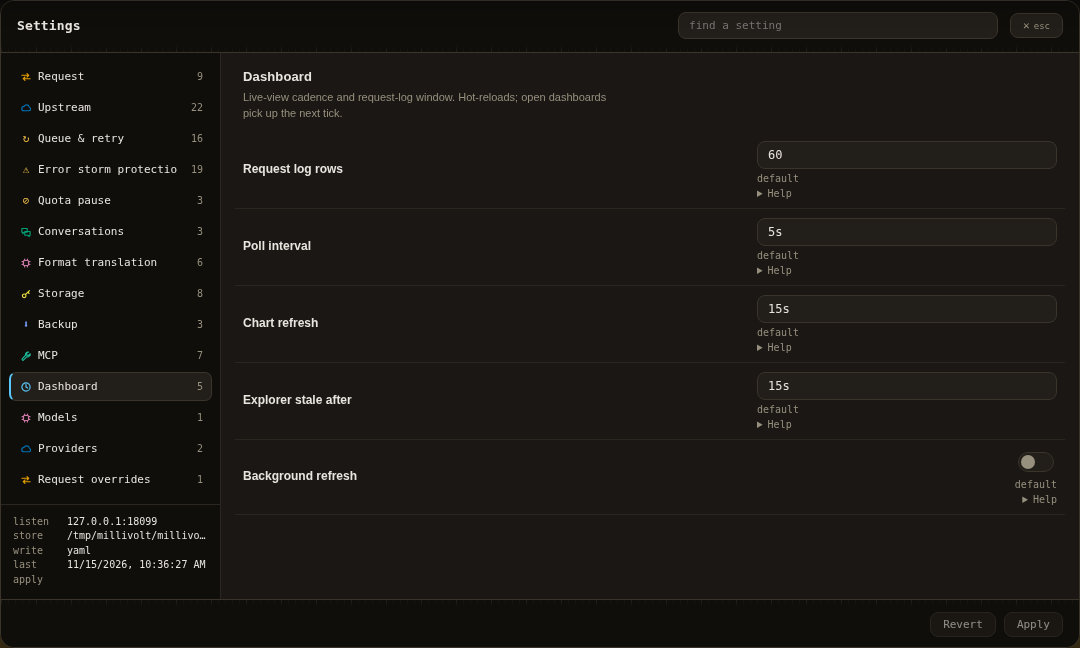
Every field is generated from the schema, including its help and the restart badge. The plate is split diagonally: the upper-left half is Instrument Black, the lower-right half is Instrument Clear.
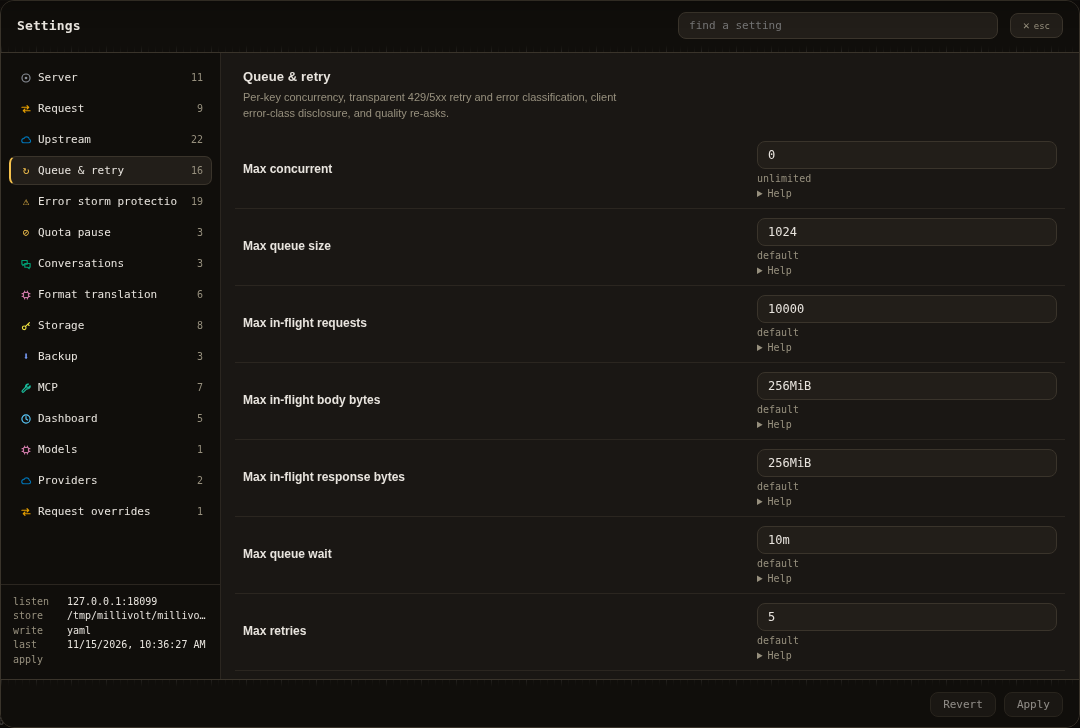
Retry policy, error classes and pacing sit together because they act on the same wait. The plate is split diagonally: the upper-left half is Instrument Black, the lower-right half is Instrument Clear.
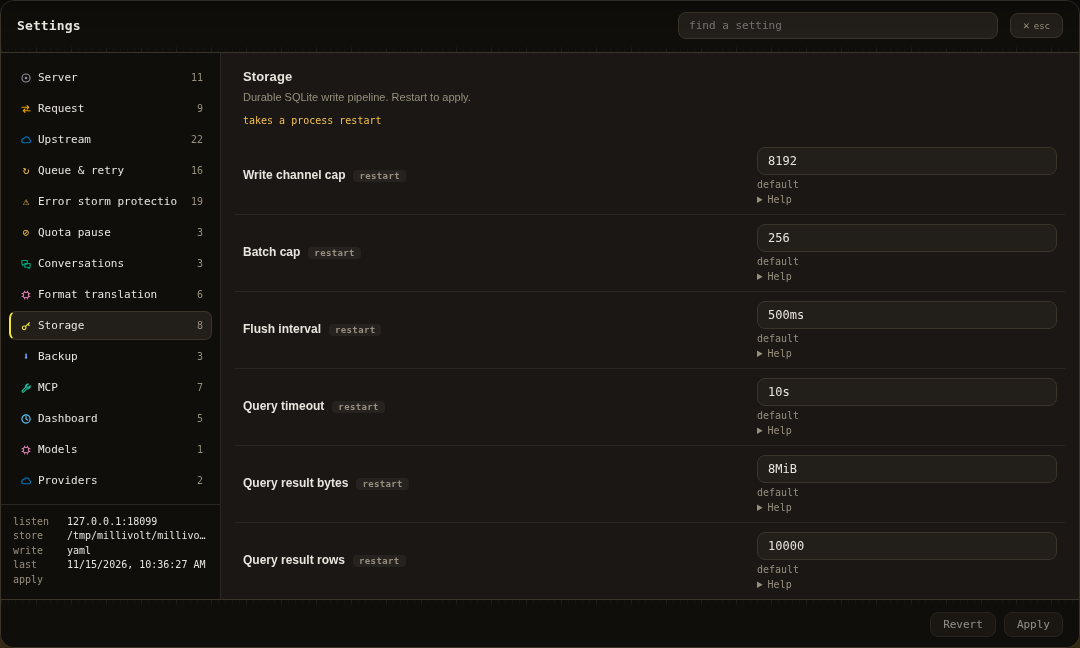
Deletion is scoped and previewed; the storage facts come from the running store. The plate is split diagonally: the upper-left half is Instrument Black, the lower-right half is Instrument Clear.
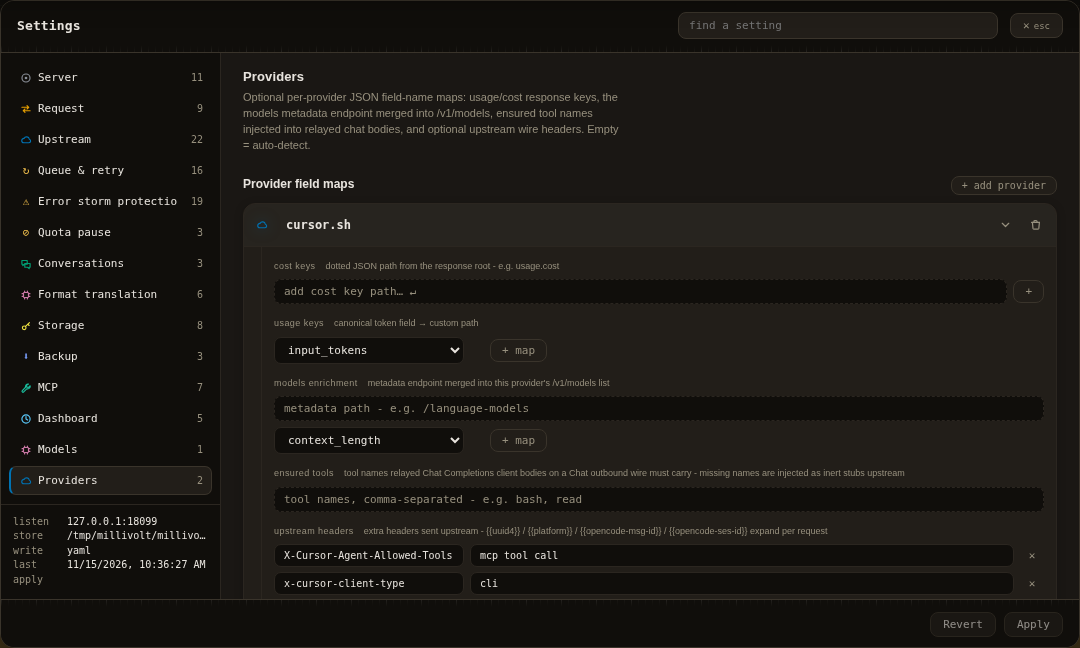
Provider data is a field map in configuration, not a branch in the router. The plate is split diagonally: the upper-left half is Instrument Black, the lower-right half is Instrument Clear.
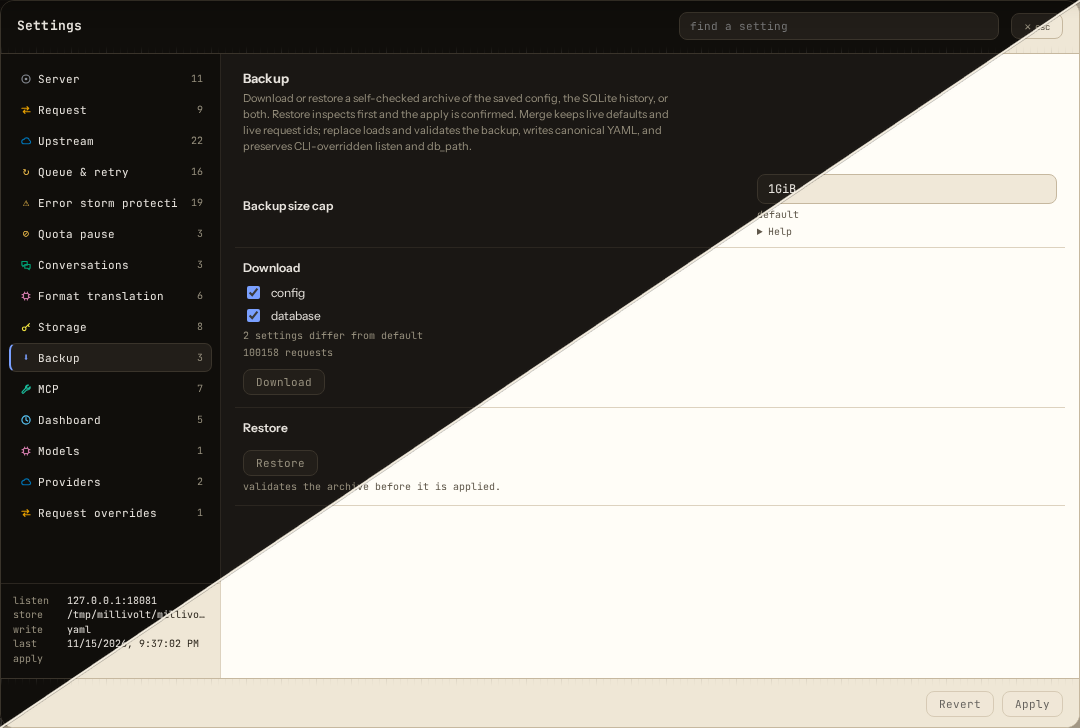
A restore is inspected before it is applied; the sheet says what will be replaced. The plate is split diagonally: the upper-left half is Instrument Black, the lower-right half is Instrument Clear.
One bench, two surfaces
The shared theme tray on Black and on Clear.
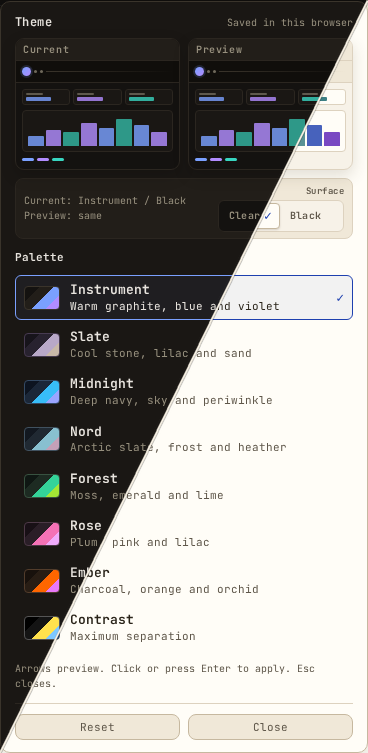
Palette, surface and order come from the same registry the site publishes; the seam is the surface switch made visible. The plate is split diagonally: the upper-left half is Instrument Black, the lower-right half is Instrument Clear.